这是一篇关于数据科学的美国作业代写
Problem 1
The director of Gainesville Sun newspaper is studying the relationship between the type of community in which a subscriber resides and the section of the newspaper he or she reads fifirst. For a sample of readers, she collected the sample information in the following table:
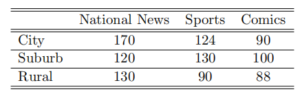
- At the 95% confifidence level, can we conclude that there is a relationship between the type of community where the person resides and the section of the paper read fifirst, i.e. are they dependent?
- What is the largest chi-square value? How would you interpret this?
- Is the number of people that read national news in rural areas greater or less than expected?
- Is the number of people that read comics in cities greater or less than expected?
Problem 2
The Federal Correction Agency is investigating whether a male released from a prison make a difffferent adjustment to civilian life if he returns to his hometown or if he goes elsewhere to live? To put it another way, is there a relationship between adjustment to civilian life and place of residence after release from prison? The counts are given in the following contingency table:
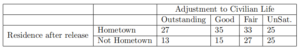
At 99% confifidence can we conclude that adjustment to civilian life and residence after release are dependent?
Problem 3
In this exercise, our aim is to quantify the associations between continuous variables and assess the statistical signifificance of these associations. For this purpose, we will use the two datasets that are provided with the assignment:
- The fifile p3a.csv contains a matrix of size 2400 x 2 which has 2400 samples and 2 variables.
- The fifile p3b.csv contains a matrix of size 110 x 2 which has 110 samples and 2 variables.
Part (a)
For the two variables provided in p3a.csv, assess the association between them by computing Pearson correlation ra and computing a p-value pa for the null hypothesis of no association. Select a signifificance level α and reject the null-hypothesis if the p-value is less than α. Explain, in complete sentences, your fifindings: Is there a statistically signifificant association (at α level) between the provided variables? What is the magnitude and the direction of the association?
Part (b)
Repeat part (a) for the variable pair provided in p3b.csv and compute Pearson correlation rb and p-value pb. Compare the Pearson correlations ra and rb as well as the p-values pa and pb. Explain your fifindings: Which variable pair (in part a or b) has a stronger association according to the comparison of the correlations? Which variable pair has a stronger association according to the comparison of the p-values? Next, draw scatter plots (variable 1 vs. variable 2) to visualize the data for both part (a) and part (b). Which variable pair (in part a or b) has a stronger association do you think according to the scatter plots? Does your conclusion agree with the comparisons of the p-values and correlation coeffiffifficients? If not, explain why would this happen.