本次澳洲作业是R语言代写数据分析的一个assignment
Some details about Question 1 and 2
For both questions, use library ”HRW” that contains the ”WarsawApts” dataset. The sym-
bol n represents length of the variables for the given dataset (WarsawApts), and a bold 1
represents vector of ones. The mean squared error (MSE) is a normalized version of residual
sum of squares (RSS) and is given as MSE=RSS/n.
Notations
Throughout this assignment, small letter represents a value, small letter attached with a
subscript represents an entry of a vector, small bold letter represents a vector, and capital
bold letter represents a matrix.
Question 1: Splines
The aim of this question is to learn how to code linear spline basis in order to approximate a
non-linear dataset via penalized spline regression (PSR). For PSR, a Cholesky decomposition
(CD) and singular value decomposition (SVD) approach can be used, but for this task the
regression based approach will be adopted, and any solution based on CD and SVD will not
be accepted. All the questions here are connected and must be attempted sequentially.
1. Store construction.date variable from WarsawApts in x and areaPerMzloty in y.
Generate 20 different location of knots and store them in vector k (ki corresponds
to i-th value of k, i = 1, …, 20) using quantile (ref: Tutorial 5 Question 2) function.
To accomplish this task, you need a numeric vector of probabilities of length 22 that
can be generated using seq(0,1,length=22), however extreme values of 0 and 1 should
be excluded from this function in order to match the knots and the samples in x (x-
intercepts).
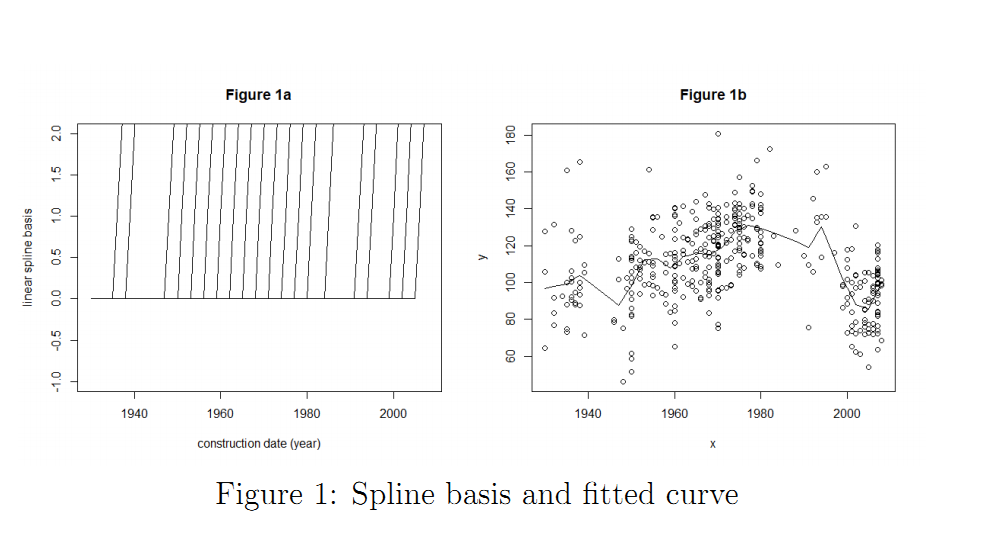
2. Using these knot locations now generate a Z matrix containing 20 linear spline basis
functions constructed using (x − ki)+. Also plot this matrix by limiting the range of
y-axis between -1 and 2 as shown in Figure 1a.
3. Using the vector of ones, x, and Z, construct a C matrix of size n × 22 (ref: lecture
slide 18 of the spline regression). Also, generate a D matrix of size 22 × 22 consisting
of ones on the diagonal entries and zeros elsewhere except the first two entries (ref:
lecture slide 30 of the spline regression). Then, 100 values of tuning parameter (λ)
selected from 0 to 50 as seq(0,50,length=100) are used to estimate the fitted curves
using penalized spline regression.
4. Now, compute the RSS errors, degrees of freedom, and generalized cross validation
(GCV) associated with 100 tuning parameters.
5. For λ corresponding to minimum GCV, overlay the true plot with a fit of y as shown
in Figure 1b. As you can see from the plot that with 20 linear spline basis the fitted
curve looks a bit too linear and might not be a good fit. Lets increase the number
of basis to 60 and obtain Figure 1c (similar to 1a) and 1d (similar to 1b). Were the
results improved by increasing the number of basis? Compute the MSE to justify the
improvement/deterioration.