这是一篇来自澳洲的作业案例分享,主要内容是一个关于R统计代写的assignment
Instructions: Questions labelled with ‘(R)’ require use of R. Please provide appropriate
R commands and their output, along with sufficient explanation and interpretation of the
output to demonstrate your understanding. Such R output should be presented in
an integrated form together with your explanations. All other questions should be
completed without reference to any R commands or output, except for looking up quantiles
of distributions where necessary. Make sure you give enough explanation so your tutor can
follow your reasoning if you happen to make a mistake. Please also try to be as succinct as
possible. Each assignment will include marks for good presentation.
1. Let X1; : : : ; Xn be a random sample from the Log-normal distribution, LN(µ; σ), whose
pdf is:

Hint: you may use the fact that if Z ∼ N(0; 1), then X = exp(µ+σZ) ∼ LN(µ; σ).
Also, the moment generating function (MGF) of a normal random variable may
be useful here.
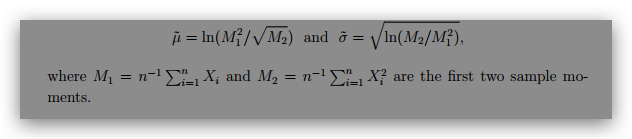
(b) Show that the method of moments estimator (MME) of µ and σ are
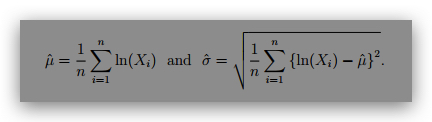
(c) Show that the maximum likelihood estimator (MLE) of µ and σ are
2. (R) The daily new COVID-19 cases were surging in Victoria since last Christmas. Let
X be a random variable representing the number of new COVID-19 cases reported in
Victoria. The following are 16 observations of X (from December 25, 2021 to January
9, 2022):
2108, 1608, 1999, 2738, 3767, 5137, 5919, 7442,
7172, 8577, 14020, 17636, 21997, 21728, 51356, 44155
(a) Give basic summary statistics for these data and produce a box plot. Briefly
comment on center, spread and shape of the distribution.
(b) Assuming a Log-normal distribution (LN(µ; σ) as in Question 1), compute maxi
mum likelihood estimates for the parameters.
(c) Draw a density histogram and superimpose a pdf for a Log-normal distribution
using the estimated parameters.
(d) Draw a QQ plot to compare the data against the fitted Log-normal distribution.
Include a reference line. Comment on the fit of the model to the data. Hint: Quan
tile for the Log-normal distribution may be computed using the qlnorm function
in R.