本次代写是R语言统计的练习题
Two-sided tests for a normal variance
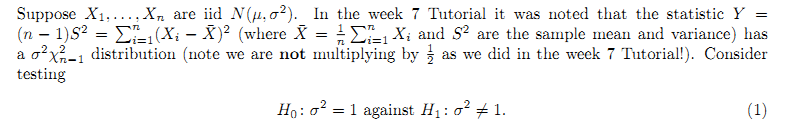
1. One possible level-a test is the \equal-tailed” test based on Y , where we reject for Y < a or Y > b where
(a) Taking a = 0:04 and n = 5, find appropriate values a and b.
(b) Defining sig.sq=(50:150)/100 plot the power of the test against sig.sq. Add a horizontal
dotted line to indicate the level.
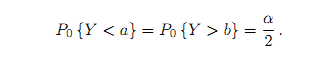
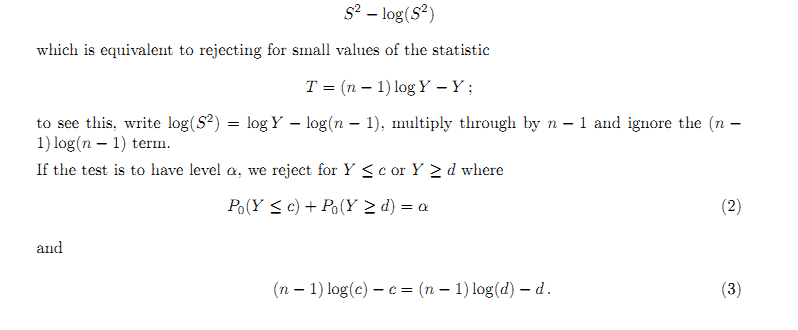
2. In Tutorial week 7 we also saw that the UMPU test rejects for large values of
(a) Write a function of the form
fn=function(c,alpha,n) f
…
g
which
• computes the appropriate d so that c and d satisfy (2);
• then computes and outputs the difference between the left-hand side and right-hand
side in (3).
(b) Use the R function uniroot() to find the root (in c) of the equation fn(c,0.04,5)=0. In
your code you will need a command along the lines of
uniroot(fn,lower=0,upper=…,alpha=0.04,n=5)
Consult the week 7 exercise for some hints as to how to choose the upper=…. When you
have worked out the right commands, wrap it all in a function of the form
norm.var.umpu=function(alpha,n) f
…
g
which returns a list containing elements $c and $d.
(c) Recreate your plot from part (b) of the previous question and add to it the power function
of the UMPU test.
3. The GLRT test of (1) above uses the statistic
![]()
which is an increasing function of Y n log Y (as opposed to the UMPU which rejects for large
Y (n 1) log Y ). Adapt your code for the previous question to compute the power of the exact
GLRT, recreate your earlier plot and add a power curve to it so it shows all 3 power curves on the 1 graph. Add an informative heading, legend, etc.. Comment on the main differences between the 3 tests.
4. As a final step, recreate your last plot but use an extended range for the parameter: sig.sq=(1:400)/100.