这是一个澳洲的R统计代写作业案例分享
Instructions: Questions labeled with ‘(R)’ require use of R. Please provide appropriate
R commands and their output, along with sufficient explanation and interpretation of the
output to demonstrate your understanding. Such R output should be presented in an
integrated form together with your explanations; do not attach them as separate
sheets. All other questions should be completed without reference to any R commands or
output. Make sure you give enough explanation so your tutor can follow your reasoning if
you happen to make a mistake. Please also try to be as succinct as possible. Each assignment
will include marks for good presentation and for attempting all problems.
1. (R) Let X and Y be the scores in Probability (MAST20004) and Statistics (MAST20005),
respectively, for a student who took both of these two subjects. A sample of n = 15
students yielded the following data:
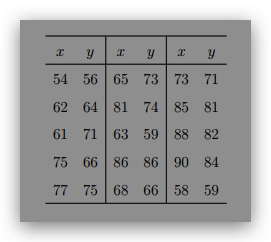
(a) Fit a simple linear regression model E(Y jX = x) = α + βx for these data. Find
point estimates of α and β. What are the standard errors of these estimates?
(b) Give a 95% confidence interval for the score in Statistics with a score of 70 in
Probability.
(c) Give a 95% prediction interval for the score in Statistics with a score of 70 in
Probability. Compare the prediction interval to the confidence interval obtained
in (b).
(d) Use a t-test to test H0 : β = 0:8 against H1 : β 6= 0:8 at the α = 0:05 significance
level and state your conclusion.
(e) Give the ANOVA table for the regression model.
(f) Use the ANOVA table (F-test) to test H0 : β = 0 against H1 : β 6= 0 at the
α = 0:05 significance level and state your conclusion.
(g) Let ρ be the correlation coefficient between X and Y , find an approximate 90%
confidence interval for ρ.
2. Assume that the distribution of X is N(µ; 25). To test the null hypothesis H0 : µ = 10
against the alternative hypothesis H1 : µ < 10, let the critical region be defined by
C = fx¯ : ¯ x ≤ 8g, where ¯ x is the sample mean of a random sample of size n = 25 from
N(µ; 25).
(a) Find the power function K(µ) for this test . Hint: power is a function of the true
parameter value.
(b) What is the significance level of the test?
(c) What are the values of K(8) and K(6)?
(d) (R) Sketch a graph of the power function. Hint: you may try µ from 4 to 12.
(e) What conclusion do you draw from the following 25 observations of X?
12.1 24.0 9.8 7.0 6.0 6.9 6.8 9.5
11.8 10.1 8.1 0.1 4.7 13.6 11.3 7.2 0.4
10.7 13.1 7.0 18.4 4.0 2.8 12.0 15.9
(f) What is the p-value of the test based on the observations in (e)?