本次澳洲代写案例分享是一个多元统计代写的限时测试
Question 1 (16 marks)
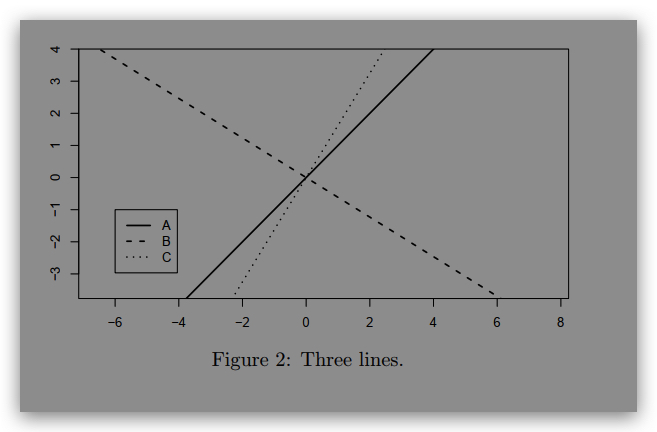
(a) Figure 1 shows the scatterplot of a bivariate dataset of 100 observations of the vector
(X1,X2), as well as 3 lines, denoted on the figure by A, B and C. One of those 3 lines
shows the direction of the first principal component of those data. Is it line A, line B or
line C? Justify your answer and make sure you compare three lines in your answer.
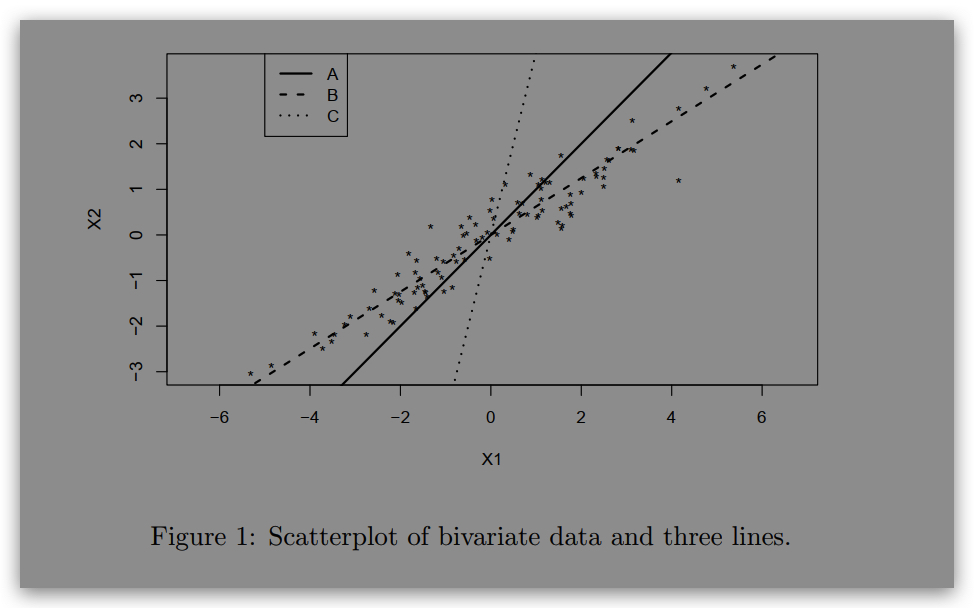
(b) We computed the direction of the first two principal components of a dataset. Figure 2
shows 3 lines, denoted on the figure by A, B and C. Two of them correspond to the
directions of the first two principal components. Is it possible to determine which two
lines from this figure give the directions of the first two principal components? If yes,
which ones are they and why? If not, why?